Here are some projects I’ve worked on.
- ClimbingBoardGPT (live demo)
- DIY home climbing board (see post)
- Climbing board data analysis and modelling
- Data Science for the Linear Algebraist (see post)
- Saiki
ClimbingBoardGPT 
ClimbingBoardGPT is the transformer/GPT follow-up to my earlier climbing board analysis/modelling projects. Where the previous work focused on exploratory analysis and traditional ML for grade prediction, here we reframe the problem entirely: climbing board routes are treated as symbolic sequences of board-aware hold-role tokens, enabling both grade prediction and GPT-style route generation within a unified modelling framework.
The core representation is a tokenized sequence—board, angle, grade, then an ordered set of hold-role tokens (start/middle/finish/foot)—with hold tokens namespaced per board so that TB2 and Kilter placement IDs never collide. This allows for a single shared vocabulary (4,438 tokens) and a unified training dataset spanning both boards (~321,000 route/angle entries: ~43,000 TB2, ~278,000 Kilter).
The grade predictor is a transformer encoder (~1.17M parameters) that takes board, angle, hold-role tokens, and coordinate features, but not the grade token, and predicts difficulty. It achieves an MAE of 1.48, with ~80% of predictions within 1 V-grade and ~95% within 2, consistent across both boards despite their different layouts and hold sets. This reinforces the earlier finding that spatial structure explains a substantial portion of climbing difficulty, now with a more expressive architecture.
The route generator is a GPT-style causal transformer (~1.41M parameters) conditioned on board, wall angle, and target grade. It produces structurally valid climbs ~92% of the time, and the trained grade predictor rates ~70% of generated routes within 1 V-grade of the requested difficulty and ~92.0% within 2. Exact grade control remains imperfect—which is expected for a small symbolic model—but the generator reliably produces plausible, novel route candidates.
The project includes command-line demo scripts for generation and grade prediction, calibrated board-background visualization, and a lightweight FastAPI web app with click-to-build route prediction and SVG overlay. All code, trained checkpoints, and executed notebooks are in the repo.
The route generator is inspired by Andrej Karpathy’s nanoGPT, a compact reference implementation for training GPT models.
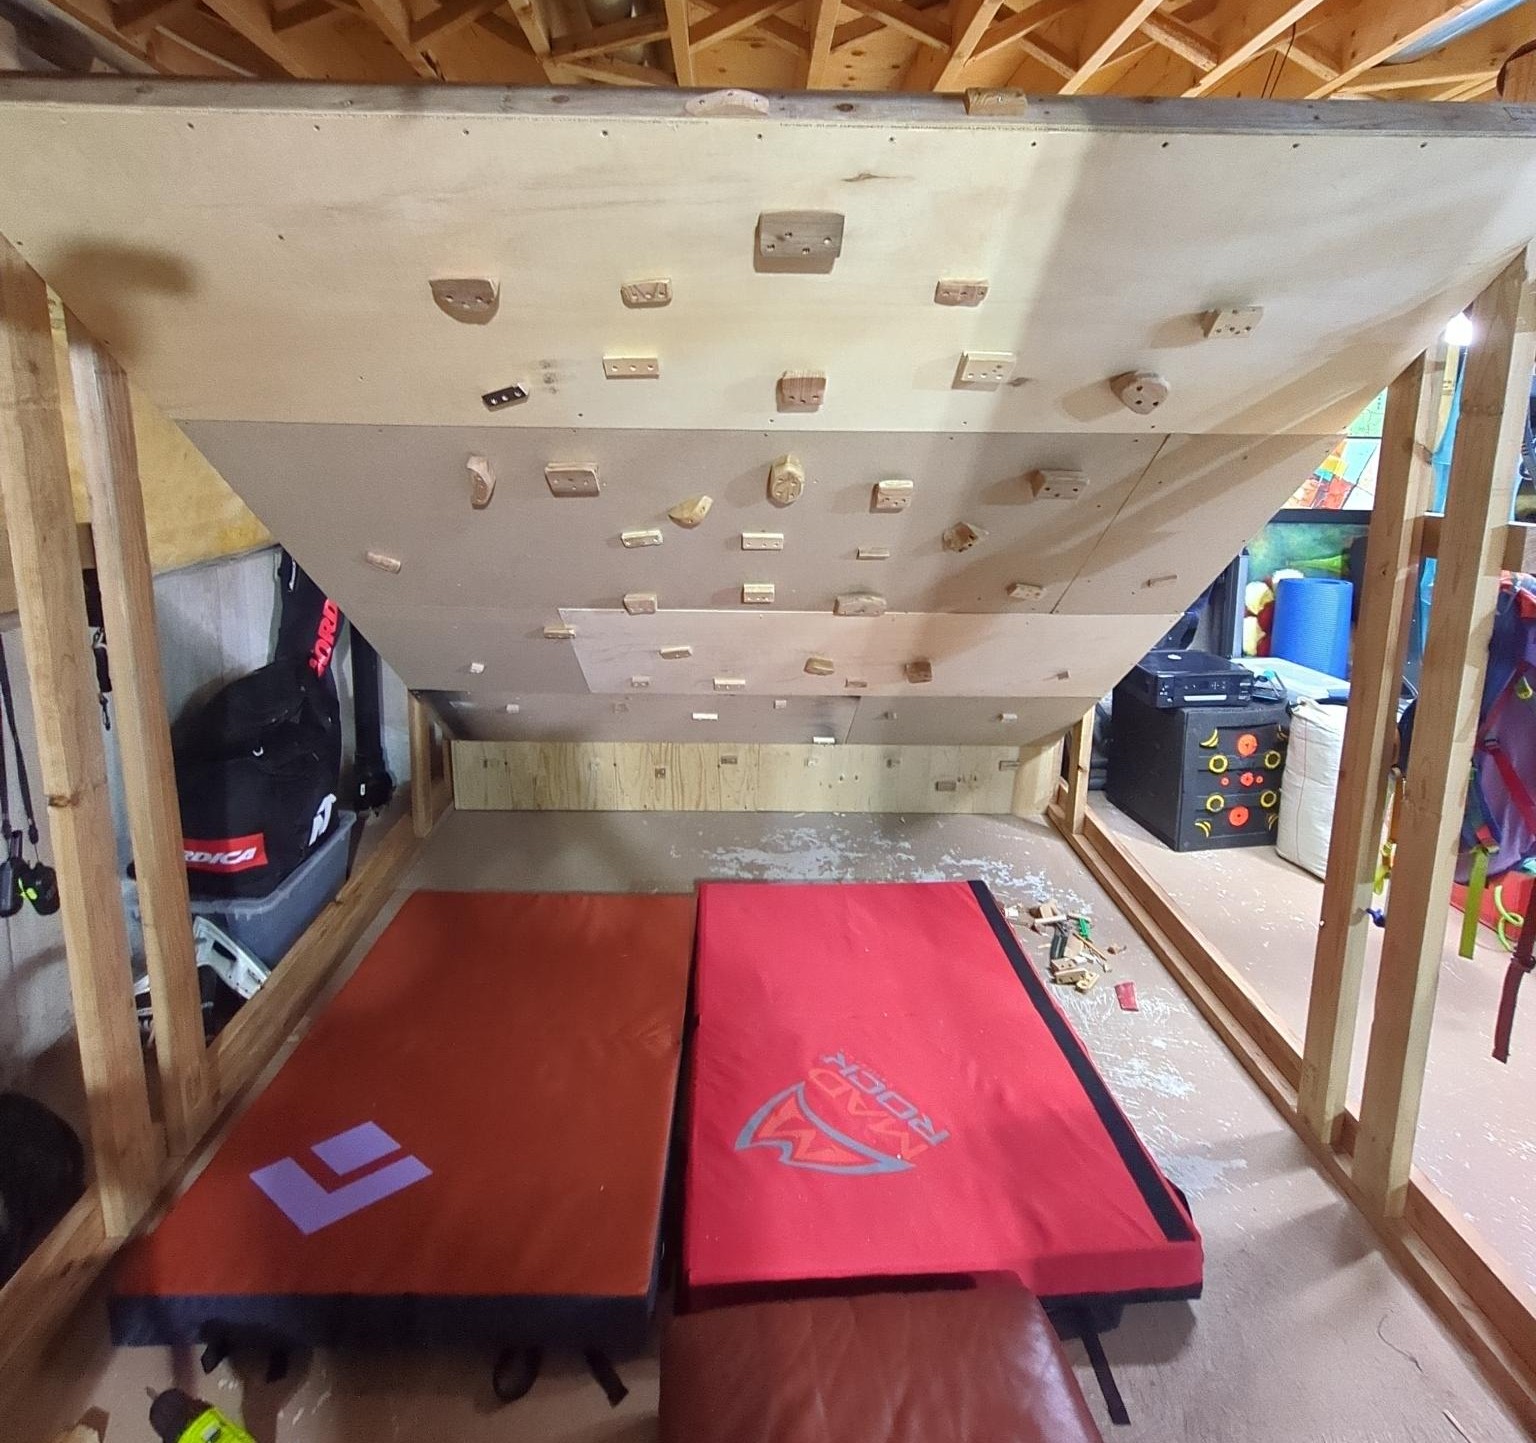
DIY home climbing board
I built a freestanding home climbing board for my basement, with the goal of making something useful, cheap, and reconfigurable without turning it into a full commercial-style adjustable board. The final design is a pseudo-adjustable wall: the main board is connected to a 1 ft kickboard with hinges, but is fixed at its climbing angle during normal use. In principle, I can change the angle later with some drilling and re-bracing, but the point was to keep the structure simple and solid rather than build a complicated adjustment mechanism.
The main climbing surface is approximately 8 ft × 8 ft, built mostly out of spare 2x4s and plywood I already had. Instead of installing a T-nut grid, I opted for homemade screw-on holds, making the wall feel more like a rough spray board than a standardized training board. The project was partly about having a training tool at home, but also partly about learning through the build itself: designing around a low basement ceiling, using imperfect leftover materials, figuring out the hinge system, and making a board that is climbable, freestanding, and essentially built from what was available.
Climbing board data analysis and modelling ( TB2 | Kilter)
I analyzed climbing board data to understand and predict route difficulty using a full data science workflow on large-scale datasets (~130,000 Tension Board climbs, including ~40,000 on TB2, and ~300,000 Kilter Board climbs). The project was structured into two main components:
- exploratory data analysis using SQL, statistical methods, and visualization, and
- predictive modelling via feature engineering and machine learning.
Across both datasets, we observed consistent patterns despite the near absence of user-level data (limited to first-ascent timestamps and ascent counts). The analysis phase explored grade distributions, angle effects, temporal trends, and spatial structure. A key component was hold-level analysis: we constructed usage heatmaps and estimated hold difficulty by aggregating climb data and applying Bayesian smoothing to stabilize estimates for infrequently used holds.
In the modelling phase, we compared linear models, Random Forests, and neural networks. A central challenge was the lack of structural information about holds (e.g., crimp, sloper, jug) and, of course, the lack of beta, requiring the model to rely purely on spatial structure. Initial models incorporated hold difficulty estimates but suffered from target leakage. After removing these features, we obtained strong and consistent results using only geometric features of climbs, achieving ~70% accuracy within ±1 V-grade and ~90% within ±2 grades. This shows that a substantial portion of climbing difficulty can be explained by spatial configuration and movement constraints alone.
Data Science for the Linear Algebraist
Here, the goal is to bridge theoretical linear algebra with practical data science: we show how concepts such as least-squares regression, matrix decompositions, and spectral theory underpin modern machine learning methods. Aimed at readers with a strong linear algebra background, the project translates standard data science terminology into linear algebraic language and develops models from first principles. Using Python (NumPy, pandas, matplotlib), we formulate regression as a matrix problem, emphasizing geometric interpretations, namely, that regression amounts to projecting onto the column space. We then discuss QR decompositions and the SVD, and highlight some things that can go wrong.
Principal component analysis (PCA) follows naturally as an application of low-rank approximation via truncated SVD, and we illustrate the spectral approach concretely through image denoising: truncating small singular values captures structure while removing noise.
Finally, we broaden the perspective to practical modelling. We cover train/test splits and cross-validation, Ridge and Lasso regularization (connecting the $L^2$ and $L^1$ penalties back to condition numbers and the geometry of norm balls); gradient descent and how convergence depends on the spectrum of $X^TX$; nonlinear models via decision trees and random forests; and logistic regression for classification. Feature scaling, hyperparameter tuning, and model interpretation are woven throughout.
Saiki
Saiki (採記) is a small CLI toolkit for Anki-based language-learning workflows on Linux. It brings the old script collection into one configurable command-line tool for
- extracting Anki audio into listening playlists,
- mining frequent words from Anki notes,
- mining vocabulary and sentence rows from YouTube transcripts,
- generating text-to-speech audio and importing sentence cards, and
- comparing generated word lists against known vocabulary,
all integrated with AnkiConnect.
The goal is automation and scalability: audio can be extracted and concatenated into playlists for passive listening, sentence lists can be converted into fully voiced Anki cards, and decks can be analyzed to produce frequency-ranked vocabulary using NLP tools such as spaCy. The system is configured through YAML, currently has defaults for Japanese and Spanish, and is designed to be easily extendable to additional languages and card workflows.